SARS-CoV-2 wastewater data from cities across Sweden now available
Published: 2021-03-16

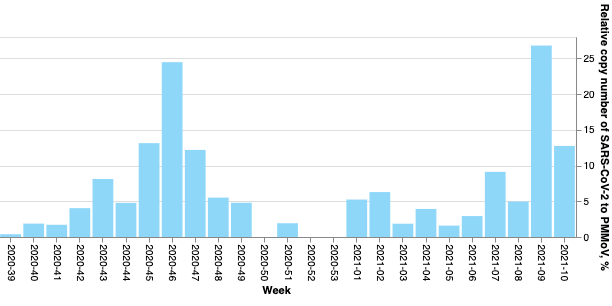
Today, the Swedish COVID-19 Data Portal is launching a page with graphs depicting the amount of SARS-CoV-2 RNA in wastewater in four Swedish cities - Uppsala, Stockholm, Örebro, and Umeå, with a total population of 1.5 million people. The corresponding data is available for download.
The presented research is carried out by research groups from the Swedish University of Agricultural Sciences and KTH Royal Institute of Technology. All research groups are part of the Environmental Virus Profiling Research Area of the SciLifeLab National COVID-19 Research Program (PIs: Anna Székely (SLU), Zeynep Cetecioglu Gurol (KTH Royal Institute of Technology), Maja Malmberg (SLU) and Klas Udekwu (SLU)).
Coronavirus genome can be detected in faecal samples from COVID-19 patients using PCR (see, for example, Wu and colleagues, 2020). Monitoring of SARS CoV-2 virus levels in communal wastewater could therefore provide early surveillance of disease prevalence at a population level. Wastewater, also referred to as “sewage,” includes water collected from households’ and other buildings’ kitchen sinks, toilets, showers. It could also include water from non-household sources such as rainwater and industrial facilities.
During the COVID-19 pandemic surveillance of SARS-CoV-2 RNA levels in wastewater has become increasingly used to monitor and predict the spread of the disease. Early during the pandemic international studies (see for example this article by Peccia and colleagues) proposed wastewater surveillance as an important source of day-to-day data. Presence of SARS-CoV-2 in municipal wastewater was reported early in the COVID-19 pandemic in studies from the Netherlands. However, wastewater surveillance has long been used to track spread of other diseases such as for example polio.

“Wastewater-based monitoring of SARS-CoV-2 offers several advantages as it reflects infections of everyone producing the analysed sewage irrespective whether they are symptomatic or asymptomatic” says associate professor Anna Székely, Swedish University of Agricultural Sciences. Anna J. Székely and her research group are measuring SARS CoV-2 virus in wastewater from Uppsala, in a collaboration with Uppsala Vatten, and are also part of the project CRUSH Covid. Their analyses have predicted both the second and third wave before cases started to increase in the city.
In Stockholm, associate professor Zeynep Cetecioglu Gurol, KTH Royal Institute of Technology, and her colleagues measure the amount of SARS CoV-2 virus in three wastewater treatment plants (six different wastewater inlets in total) since April 2020. They observed the first wave and predicted the second and third wave for the Stockholm region. In addition to the monitoring wastewater, they compared four different concentration methods during the summer and recently published a methodological study, Jafferali and colleagues 2020. This study showed that the method which is adapted by KTH team was the most sensitive for detection of SARS-CoV-2 in wastewater among four different methods that were tested.
In addition, the researchers in Stockholm have shown, in preliminary yet unpublished data, that increased SARS-CoV-2 levels in Stockholm correspond to both increased ICU admission levels and positive case numbers (see figure below). Zeynep Cetecioglu Gurol explains: “These results are important to show the significant correlation between gene copy number of SARS-CoV-2 in wastewater and positive case numbers. In addition of the reflection of transmission in the population, wastewater data provides us an early information of upcoming waves.”

Associate professor Maja Malmberg, SLU, is collaborating with Mette Myrmel at the Norwegian University of Life Sciences to measure SARS CoV-2 levels in Umeå and Örebro. “By sharing our SARS CoV-2 wastewater data openly on the COVID-19 Data Portal we can in an easy and quick way make the results available to the general public, relevant authorities and researchers. I hope this can be useful as an early warning system for new waves of COVID-19 and contribute to preparedness for future pandemics,” says Maja Malmberg.
The graphs and data download links can be found here. The datasets behind these graphs will be updated on a weekly basis (Stockholm and Uppsala) and montly (Umeå and Örebro)